How to interpret Doppler lidar images

This page should help you understand what the Doppler lidar is seeing in these real-time Doppler lidar images.

A separate page explains what volcanic ash looks like to the Doppler lidar.

Lidar Backscatter: Doppler lidars measure `lidar backscatter' which is essentially proportional to the number of particles multiplied by their area. Hence, liquid layers (composed of cloud droplets typically about 10 microns in diameter) provide a stronger return than the much more numerous, but smaller, aerosol particles (usually less than 1 micron). Large raindrops and snowflakes also provide a strong backscatter signal because of their size (1 mm or greater) even though their number conentration is much smaller. Ice crystals, however, have a wide range of lidar backscatter intensities because they occur in a wide range of number concentration and sizes.

Active instruments which transmit at wavelengths close to visible are also very susceptible to attenuation. Liquid layers will often completely attenuate the lidar signal so that you can not see any further than 300 m into the layer, and will not detect any cloud above this level.

Doppler velocities: Doppler lidars also measure the Doppler velocity of particles that are responsible for the backscatter signal. When pointing vertically, the Doppler velocity is the sum of the particle terminal fall speed and the vertical air motion (-ve velocities are downwards). For particles with no appreciable terminal fall velocity, such as aerosol and cloud droplets (a few cm s-1), the Doppler velocity corresponds to the air motion only - hence we obtain the vertical wind (we obtain horizontal winds by taking orthogonal scans off-vertical). In the convective boundary layer, and in liquid layers, the vertical air motion can vary rapidly and significantly (-1 to +1 m s-1) from profile to profile due to turbulence. Larger particles, such as ice crystals and drizzle droplets, have appreciable terminal fall speeds of 1-2 m s-1 or more, and rain drops can easily reach 7 m s-1.

Lidar depolarization: Lidar depolarization gives an idea of the sphericity of the particles that are responsible for the lidar backscatter. True spherical particles, such as liquid cloud droplets and hydrophilic aerosols at ambient RH will have a very low value of depolarization (less than 0.1 and, for aerosol, often not seen because the depolarized signal is below the sensitivity of the instrument). Pristine ice crystals and snowflakes have a very high value of depolarization (close to 0.5) although the value can be lower for aggregates. Dry desert dust and volcanic ash particles have irregular shapes and will also show signficant depolarization (about 0.3), although this can change depending on the age: particles lose their sharp edges over time and become more rounded.

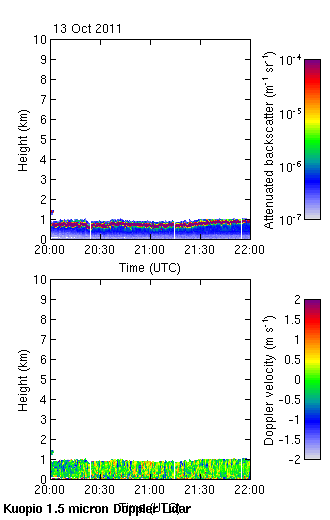
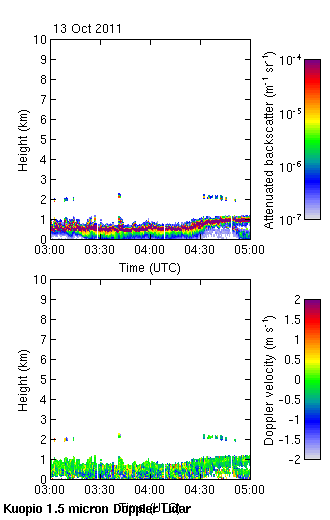
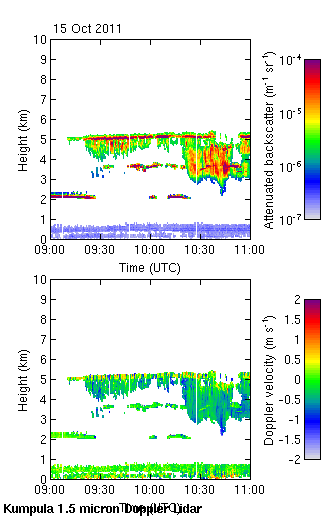
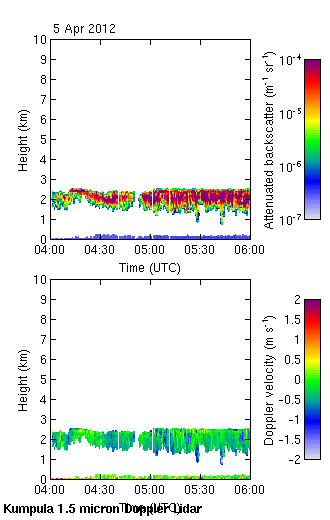
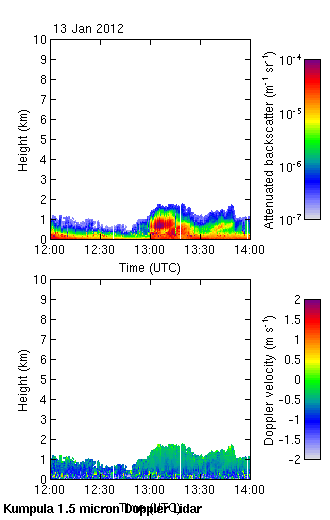
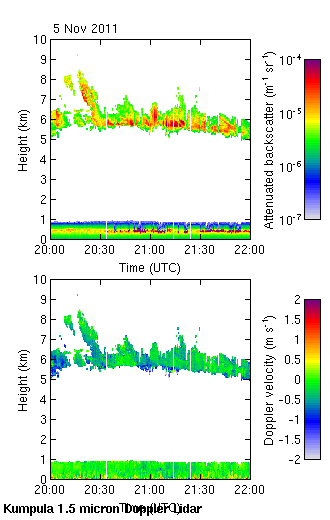
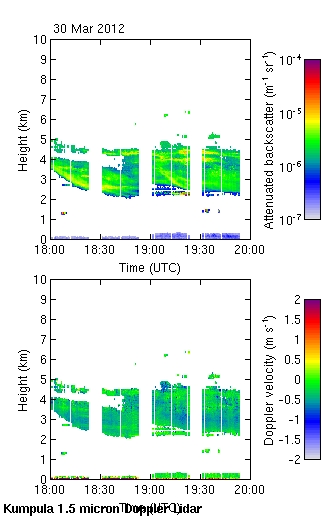
The images below are all two hour sections. The upper panel depicts the lidar backscatter on a logarithmic scale, the lower panel is the Doppler velocity (particle terminal fall velocity + vertical air motion).

Stratocumulus
This is very common cloud type and is composed entirely of liquid water droplets. These droplets are reasonably small (around 10-20 microns in diameter), but are very numerous (100 per cc or more) so give a very strong lidar signal. Liquid layers also rapidly attenuate the lidar signal so that you cannot see through the layer.
Stratocumulus with drizzle
If stratocumulus is more than a few hundred metres thick, then larger `drizzle' drops (around 100-200 microns in diameter) can grow. These may be larger, but their number concentration is much lower, so the backscatter signal is usually much lower than for the liquid layer itself. Drizzle usually evaporates before reaching the surface.
Altocumulus
This mid-level cloud occurs below freezing and is typically composed of a thin layer of supercooled liquid water droplets at the top, with ice crystals falling below in a layer that can reach a couple of km deep. The liquid droplets are about 10 microns in diameter, whereas the larger, but less numerous, ice crystals may be several hundred microns across.
Altocumulus with specular reflection
Altocumulus for Doppler lidars pointing at vertical may sometimes look slightly different. In certain conditions the pristine ice crystals falling below the liquid layer may behave like mirrors, causing anomously high backscatter, termed specular reflection. This may also impact the depolarization signal, causing it to be much lower than expected.
Snow
Frontal or `stratiform' snow (and rain) looks like this. Ice crystals nucleate high in the atmosphere and grow as they fall, potentially reaching sizes of a few cm. The fall velocities of ice and snow are usually not much larger than 1 m s-1. The fall velocity increases rapidly at the melting level, if present, to greater than 4 m s-1 and the typical rain drop size is a few mm. The effects of attenuation by snow and rain are clearly visible as the lidar backscatter decreases by three orders of magnitude within a km or two, however this is not as rapid as seen in liquid layers composed of much more numerous small droplets. Note that it is possible for rapid attenuation to occur if a liquid layer is present within the raining profile!
Cirrus
Cirrus clouds are composed purely of ice crystals and are characterised by their classic `fallstreak' structure. Depending on the number and size of ice crystals present, it is possible to see few km into these layers before the lidar signal is attenuated.
Aerosol
Doppler idars are also sensitive to aerosol when present in large concentrations, typically throughout the boundary layer. Because these small particles have no appreciable terminal fall velocity, they provide excellent tracers of the wind, and therefore turbulence. Note the increase in the variability of the Doppler velocity with time and how this also increases with height - starting at the surface only in the morning, and reaching throughout the lowest km by 10 UTC.
Gaps in data
For certain instruments you may have spotted occasions when the lidar data looked like this - these large gaps in the vertical data are due to the instrument operating in another mode. The instrument may be dwelling across a specific location or scanning in the horizontal or vertical plane. Small gaps may also be noticed - this is because each lidar also performs a DBS scan to retrieve horizontal winds at regular intervals.

This page is maintained by Ewan O'Connor. Last update: 5 April 2012

All content Copyright © Finnish Meteorological Institute (FMI) unless otherwise stated.