Volcanic ash
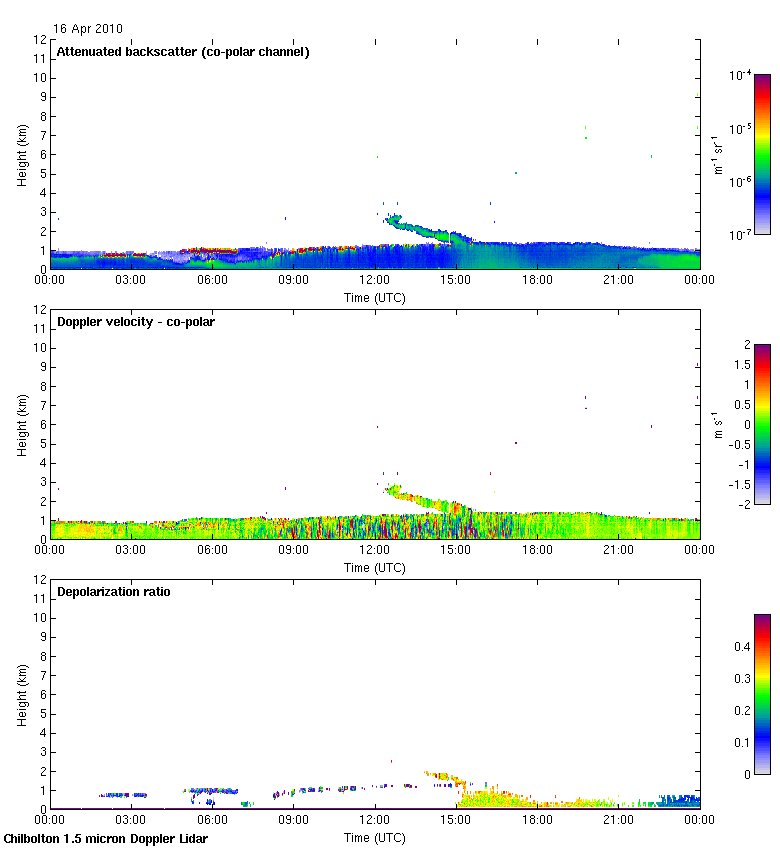
This is an example of a volcanic ash layer from Eyjafjallajokull in April 2010 that was seen over Chilbolton in the UK by a similar instrument.
The volcanic ash layer is visible as the green layer above the boundary layer from 12Z to 15Z (at 3 km lowering to 1.5 km). The depolarization value is about 0.3. After 15Z the volcanic ash layer begins to interact with the boundary layer and rapidly disperse throughout the depth of the boundary layer (1.5 km). This can be deduced from the depolarization signal in the boundary layer, which suddenly shows values close to 0.3 (from nothing) and then slowly falls throughout the next 9 hours (0.15 at 23Z) as the volcanic ash presumably mixes with more hydrophilic aerosol in the humid boundary layer and/or is deposited at the surface.
Note that the ash layer appears reasonably thin, not much thicker than about 500 m so similar to a liquid layer, but does not have the same backscatter intensity as the liquid layer. In this example, the volcanic ash particles were estimated to be quite large, about 2 microns in size, with mass concentrations of probably 1 mg mm-3. Usually, ash layers will have lower backscatter than is seen here.
This page is maintained by Ewan O'Connor. Last update: 5 April 2012
All content Copyright © Finnish Meteorological Institute (FMI) unless otherwise stated.