Atmospheric icing occurs when super-cooled water droplets freeze while contacting objects. Icing problems can be especially dangerous for aviation and road traffic.

Atmospheric icing can be monitored using ceilometers and in-situ measurements. Ceilometer is a certain type of lidar - an active remote sensing instrument providing information about clouds and aerosols in the lower troposphere. Icing can be classified by combining ceilometer observations with temperature information.
In-situ sensors provide quantitative information about ice-formation rate, i.e., how thick layer of ice will form on a surface in a certain time. Short-term icing condition forecasts can also be estimated using a model. The model forecast on this website is updated four times a day.
Below you can find more information about the icing-related data products.
 |
|
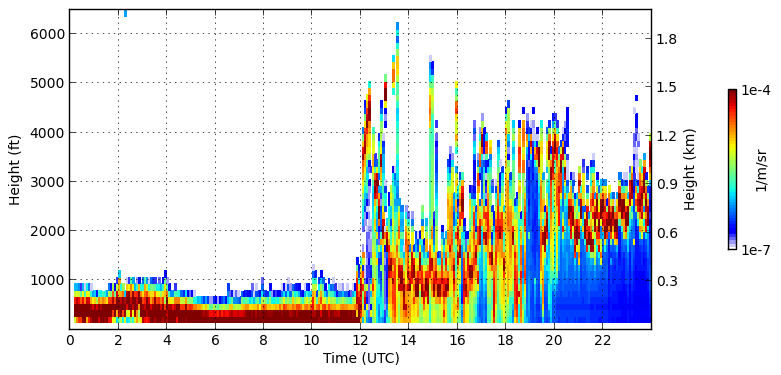
Aerosol particles and hydrometeors contribute most on the ceilometer backscatter signal from the atmosphere. Ceilometer was originally developed for cloud ceiling. Such information is used especially by aviation and airports. However, during recent years, data processing of attenuated backscatter coefficient profiles measured with a ceilometer has further been developed. This enables using ceilometers in many new atmospheric applications (such as icing classification or identifying icing conditions). Simplified classification of scattering targets in the time-height colour plot of attenuated backscatter coefficient can be summarised in the following way
Ceilometer signal attenuates quickly (within 120 m) in a cloud consisting of liquid droplets. Therefore, any cloud layer (and often even the first cloud top) above liquid droplet cloud cannot be observed with a ceilometer. More information on ceilometers can be found e.g. in COST EG-Climet report by Illingworth et al. (2013). |
 |
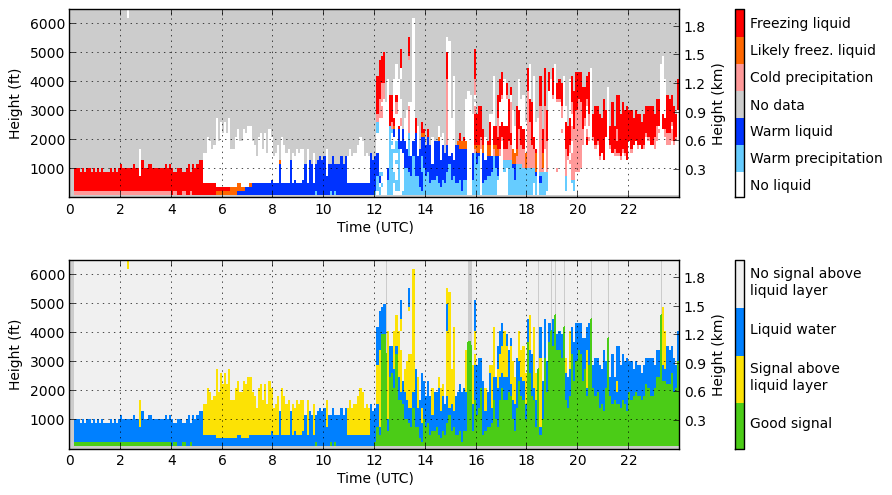
The classification is based on detecting warm (blue color) and super-cooled liquid water droplet containing clouds from ceilometer attenuated backscatter profile observations. Super-cooled liquid water layers are indicated as freezing (red color) or likely freezing (orange color) based on available temperature information. Precipitation from liquid water containing clouds is also detected, and classified as warm (light blue color) or cold (light red color) precipitation based on temperature. Precipitation type is not specified at this state of project. Ceilometer beam attenuates quickly in the liquid water droplet containing clouds. Often only the first cloud layer can be observed with a ceilometer. Therefore, it is not possible to analyze atmospheric conditions with ceilometer when detection status of classification indicates that signal originates above liquid water layer. |
 |
|
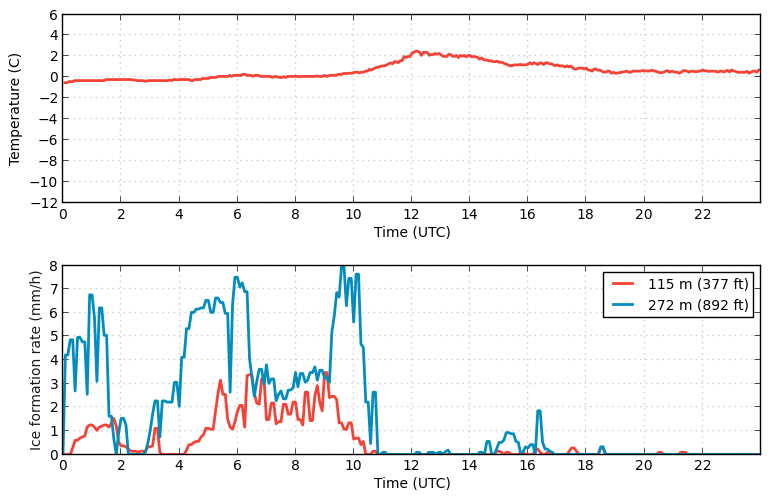
Our in-situ icing sensors have an oscillating sensing rod, whose oscillation frequency decreases proportionally to the accumulated ice mass when ice forms
and accumulates on the rod. When the frequency falls below a certain limit, the sensing rod is heated in order to melt the ice and dry the rod, and make the sensor ready for new ice detection cycles.
The ice formation rate (mm/h) is calculated from the oscillation frequency decrease rate and physical dimensions of the sensing rod. The ice formation rate is considered light when it is less than 0.25 mm/h, moderate when it is 0.25-0.50 mm/h, and heavy when it is more than 0.50 mm/h. Currently, the in-situ ice formation rate is measured at two altitudes, 115 m (377 ft) and 272 m (892 ft) above ground. |